Board of Directors Situation Report
ECONOMIC SITUATION
Last year, the global economy kept to its growth trajectory. In addition, base rates hardly strayed from their minimum levels as muted inflation is still very low in developed countries, including the Czech Republic. One of the key developments we witnessed was the marked economic slowdown in countries commonly referred to as emerging markets, and China in particular, compounded by weakening local currencies. This has been especially true of commodity-oriented economies such as Russia and Brazil. Starting last August, the interplay of these factors made the capital markets all the more skittish and wobbly, especially as the bad news from China took hold. At the end of the year, the US central bank embarked on its first interest-rate hike in nine years.
On the bond markets, the originally forecast surge in interest yields failed to materialise. It was stalled by pitiful inflation, kept low primarily by dwindling oil and energy prices. The European Central Bank (ECB) joined in the melee against low inflation by cutting interest rates further and intensifying its secondary-market bond purchase programme. This activity fuelled the growth of risk-bearing assets, spearheaded by European equities, and triggered the further appreciation of the US dollar to a level approaching USD 1.05 per EUR. On the bond markets, risk-free yields contracted further and even stepped into negative values. This means that investors are now paying for the privilege of being able to purchase high-grade sovereign debt. Corporate bonds buck the trend and are perhaps a last resort when it comes to investors’ opportunities to identify lucrative potential bond appreciation.
On the other hand, there were seismic shifts on the commodity and stock markets. The spotlight was on oil prices and, in the second half of the year, events in China, along with the launch of a sequence of rate increases in the US. Oil prices plunged to the magic level of USD 35 a barrel, the lowest in 11 years. This is exceptionally good news for consumers. Oil and energy companies, on the other hand, have been experiencing a barren period since 2014. This is an unusual situation where companies’ real costs are way higher than market prices. This is unsustainable in the long run and runs the risk of sparking another sharp rise in prices, just as we saw in 2009 when the oil price doubled in the space of a year. It also had a negative impact on the performance of commodity-oriented funds. There were interesting developments in European equities. Despite reporting more than 20% growth – driven by the depreciating euro and the ECB’s expansionary monetary policy – at the mid-year point, these gains ran out of steam by the end of the year as global factors came to the fore. Investor interest last year centred on the real estate sector and on pharmaceuticals and biotechnology.
INSURANCE INDUSTRY
The Czech Insurance Association’s preliminary results for 2015 reported growth in total premiums written by CZK 1.1 billion, or 1%. As in the previous year, the insurance market was kept afloat by non-life insurance, which expanded by 4%. Conversely, life insurance was eroded by a further 3.5% year on year.
Life insurance billing contracted by nearly CZK 1.6 billion compared to 2014. Single-premium policies were hardest hit (-26.7%). However, it is the situation among regular-premium policies, covering clients’ everyday risks in life, that is particularly downbeat (-2.1%). Sadly, life insurance as a long-term means of protection from risks and an opportunity to build up reserves for old age is seriously underestimated, a trend confirmed by the loss of more than 250,000 life insurance policies last year.
Last year, life insurance was affected by legislative changes covering the conditions of tax deductibility. Issues surrounding policy switching and the related communications also undeniably had a negative impact. Not least, low interest rates could be felt in all areas of the financial market and, beyond any shadow of a doubt, will continue to hold sway over life insurance this year.
In contrast, there were positive developments in non-life insurance, where premiums written climbed by CZK 2.7 billion from CZK 68.9 billion in 2014 to CZK 71.6 billion in 2015. Motor third party liability premiums were up by 1.9%, mainly on the back of growing numbers of vehicles. Nevertheless, overall MTPL remains in the red.
Broadly speaking, MTPL rates have stalled. Competition is shifting away from pricing policy as more of an emphasis is placed on the scope of service provision. This is reflected in particular in the more meticulous way in which risks are taken into account and in the personal approach to each client.
The collision insurance growth rate also picked up momentum at the end of 2015, rising from 5.3% to the present 6.1%. This progression in vehicle insurance stemmed from the economic recovery in tandem with the emerging passion for new and more expensive cars.
An instrumental factor in the growth reported by non-life insurance was business risk insurance, where, although dynamism tapered off somewhat, premiums written went up by 3.6% to a level approaching CZK 19 billion. Businesses took out over 20,000 policies more than in 2014. This greater interest in covering business risks was closely linked to the state of the Czech economy, improvements in which should continue to push forward business insurance in 2016.
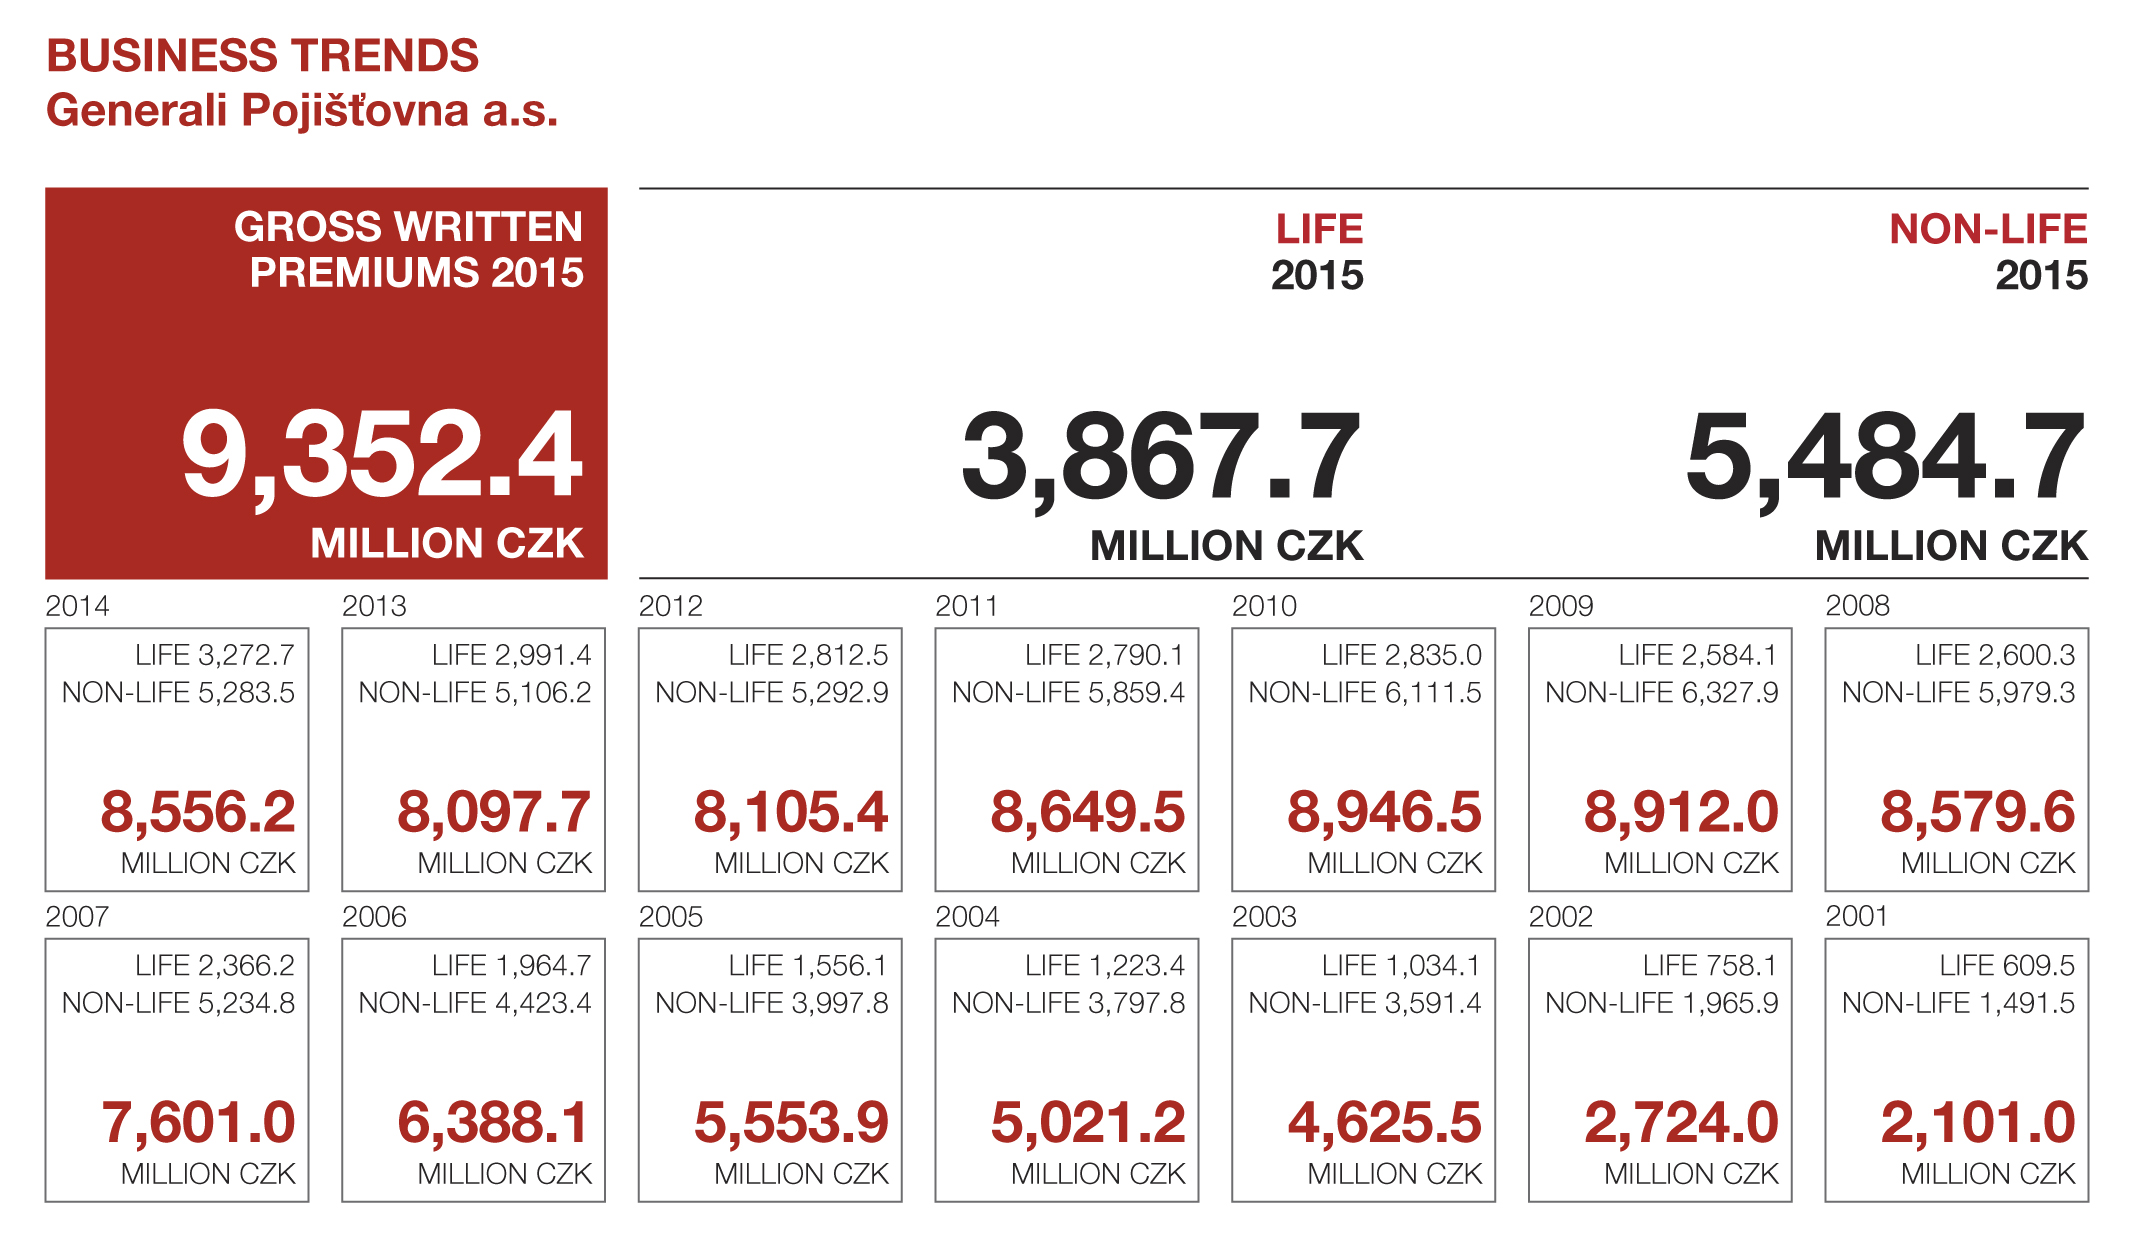
In 2015, Generali again enjoyed success in maintaining its market position and remains the fourth-largest insurance company on the Czech insurance market. It is the fifth largest life insurer, holding a 7.2% market share and, likewise, the fifth most powerful insurance company in non-life insurance, claiming a 7.6% market share.
Gross Written Premiums
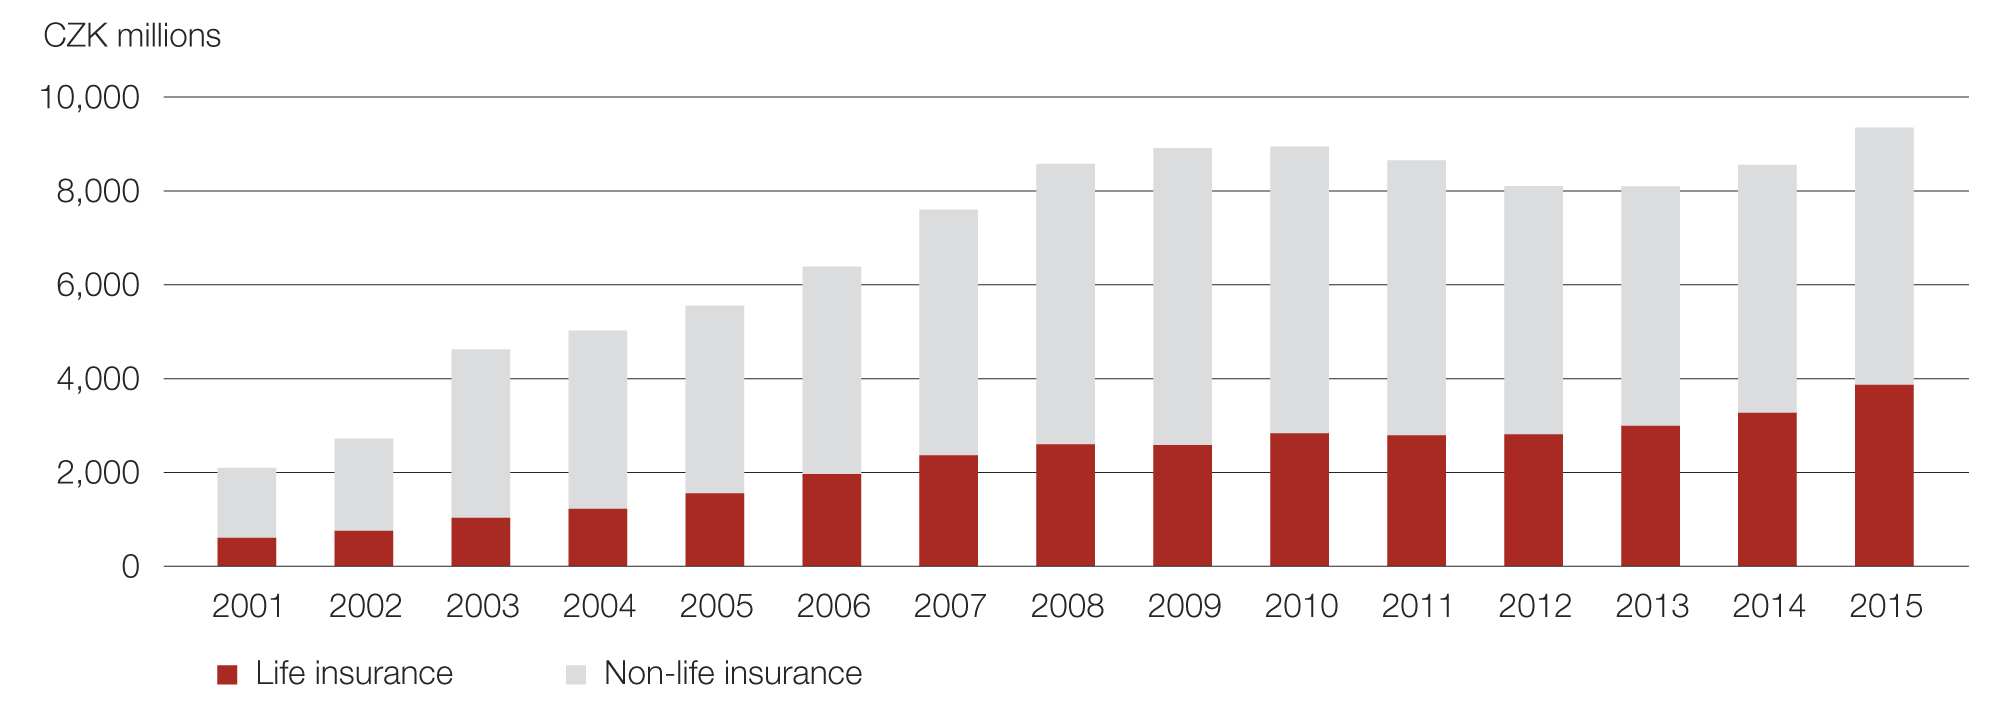
As at 31 December 2015, Generali was managing more than 1,484,529 insurance contracts. Gross written premiums totalled CZK 9,352.4 million, up from CZK 8,556.2 million in the previous year. Life insurance written premiums were just shy of CZK 3.9 billion. Overall non-life insurance billing climbed to nearly CZK 5.5 billion.
Technical provisions at the Company are set at such a level that, in keeping with accepted actuarial rules, all liabilities to clients can be met. Provisions are safely covered by capital investments. Technical provisions under life and non-life insurance, totalling CZK 15.3 billion, are backed by capital investments worth CZK 20.2 billion.
Our investments are governed by the principles of maximum security, reasonable profitability and sufficient liquidity. We diversify funds in a multifaceted portfolio. Much of the investment has been channelled into government bonds, CZK Eurobonds and time deposits at top-quality banks. Our sensible investment policy bore fruit in 2015, at a time when reverberations from the economic recession experienced in recent years were still being felt on the Czech insurance market.
The claims costs of CZK 4,542.4 million did not overstep projections. Non-life insurance claims paid, including claims handling expenses, amounted to CZK 2,773.2 million. Life insurance claims came to CZK 1,769.2 million.
In defiance of the pronounced macroeconomic impacts on the Czech insurance market, Generali made a profit of CZK 482.6 million (2014: CZK 27.8 million) according to IFRS (International Financial Reporting Standards). This result can be attributed to three key factors: a prudent investment policy, the efficient management of operating costs, and the technical results of selected types of insurance. No incidents have occurred in our business operations so far that might affect the annual result planned for 2016. A client-oriented approach remains our top priority, and as such Generali devotes considerable effort and funds to this goal.
We are trying to increase premiums written in all encouraging lines of insurance while keeping a lid on any growth in costs. In the next few years, we expect to improve our economic performance – with growth to match – while consolidating our market position.
In conclusion, we would like to convey our gratitude in particular to our clients and business partners for their confidence in Generali. We would also thank all of our employees, captive and independent insurance agents, insurance brokers and all those who contribute to the Company’s development every day.
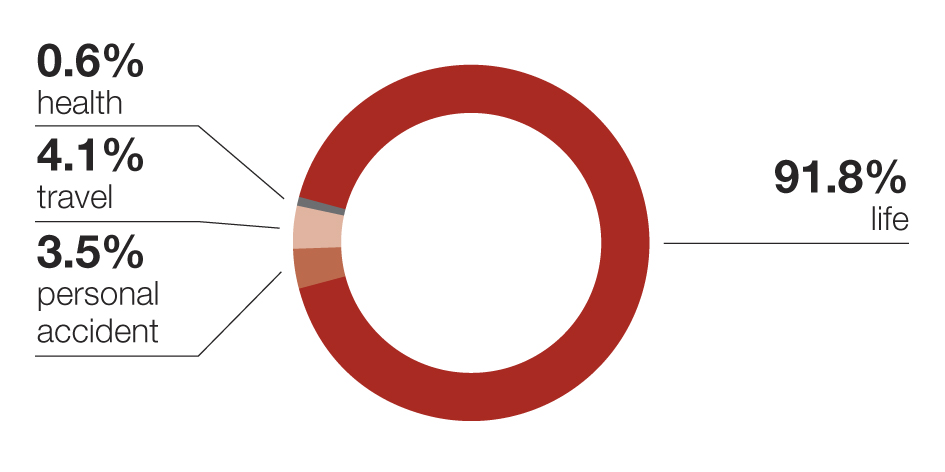
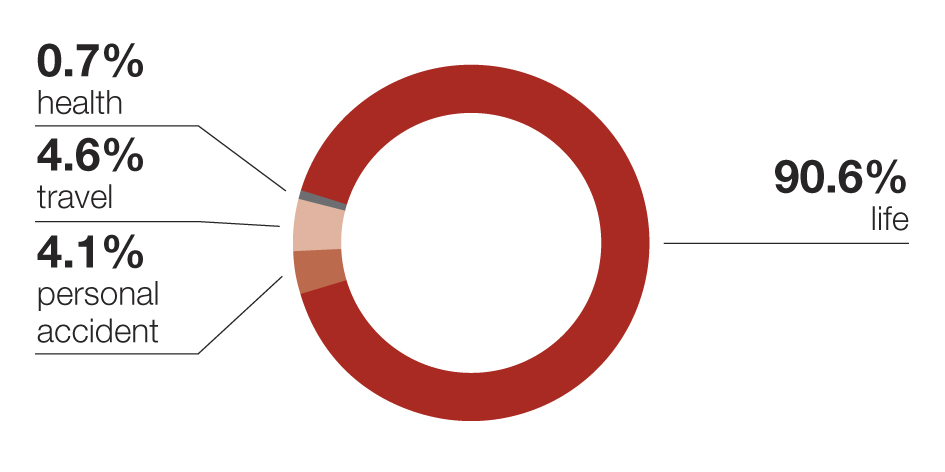
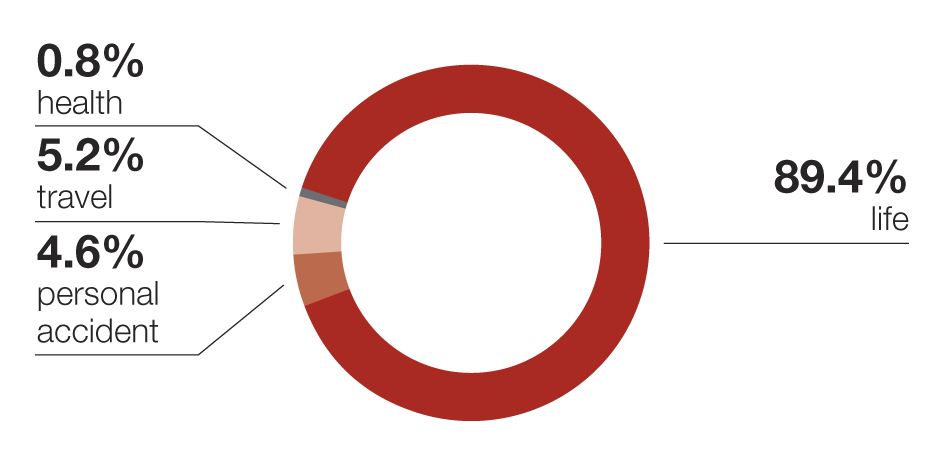
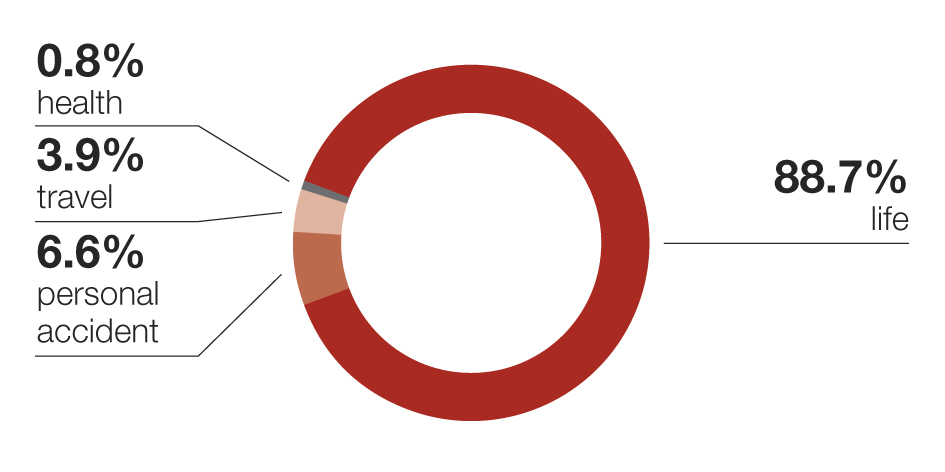
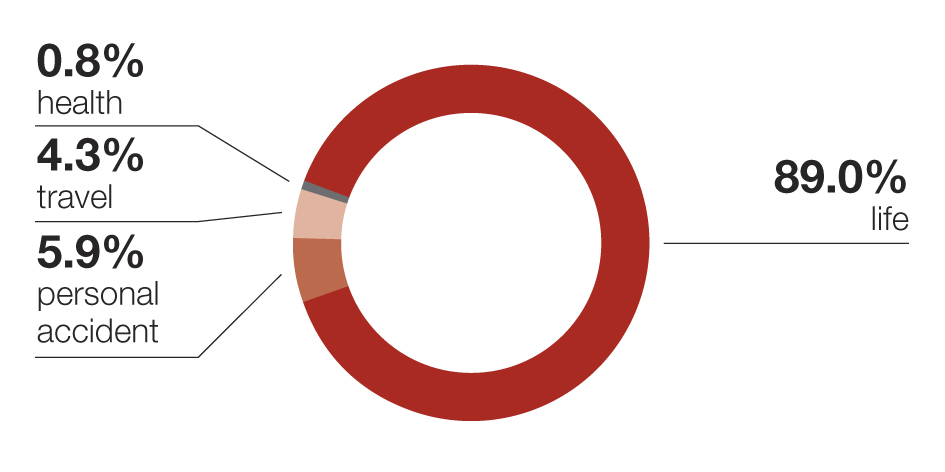
Personal Insurance
| CZK millions | 2015 | % | 2014 | % | 2013 | % | 2012 | % |
|---|---|---|---|---|---|---|---|---|
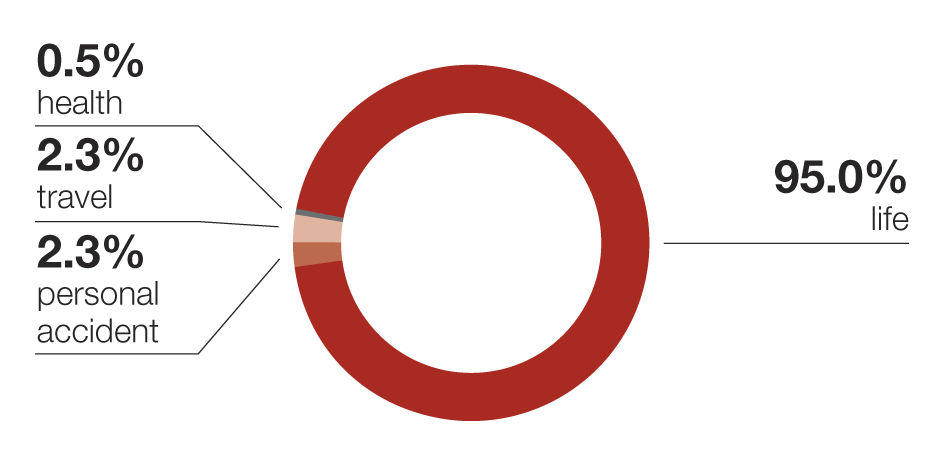
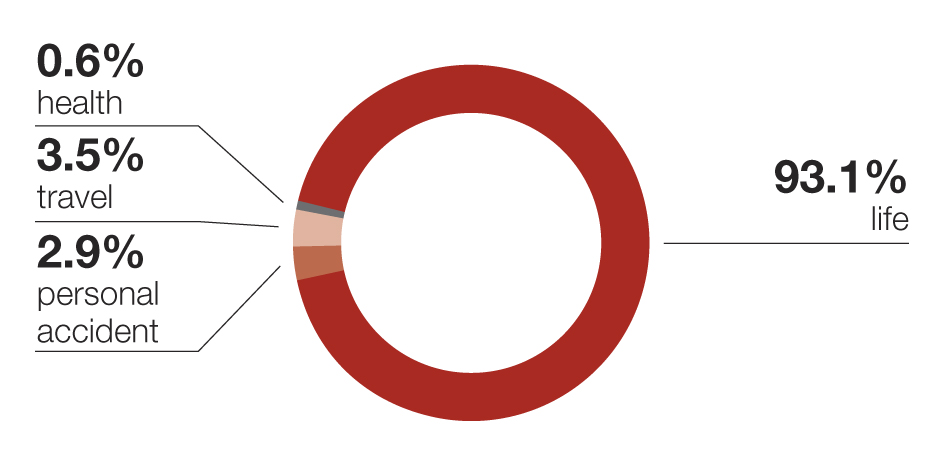
| Life | 3,867.7 | 95.0% | 3,272.7 | 93.1% | 2,991.4 | 91.8% | 2,812.5 | 90.6% |
| Personal accident | 93.4 | 2.3% | 101.6 | 2.9% | 114.0 | 3.5% | 125.7 | 4.1% |
| Travel | 92.8 | 2.3% | 121.6 | 3.5% | 133.0 | 4.1% | 142.8 | 4.6% |
| Health | 18.9 | 0.5% | 20.0 | 0.6% | 21.0 | 0.6% | 23.1 | 0.7% |
| Total | 4,072.8 | 100.0% | 3,515.9 | 100.0% | 3,259.4 | 100.0% | 3,104.2 | 100.0% |
| CZK millions | 2011 | % | 2010 | % | 2009 | % | 2008 | % |
|---|---|---|---|---|---|---|---|---|
| Life | 2,790.1 | 89.4% | 2,835.0 | 89.5% | 2,584.1 | 88.7% | 2,600.3 | 89.0% |
| Personal accident | 143.3 | 4.6% | 176.8 | 5.6% | 191.2 | 6.6% | 171.2 | 5.9% |
| Travel | 163.4 | 5.2% | 132.3 | 4.2% | 112.3 | 3.9% | 126.5 | 4.3% |
| Health | 24.0 | 0.8% | 22.8 | 0.7% | 24.1 | 0.8% | 23.3 | 0.8% |
| Total | 3,120.8 | 100.0% | 3,167.0 | 100.0% | 2,911.7 | 100.0% | 2,921.3 | 100.0% |
2015
2014
2013
2012
2011
2010

2009
2008
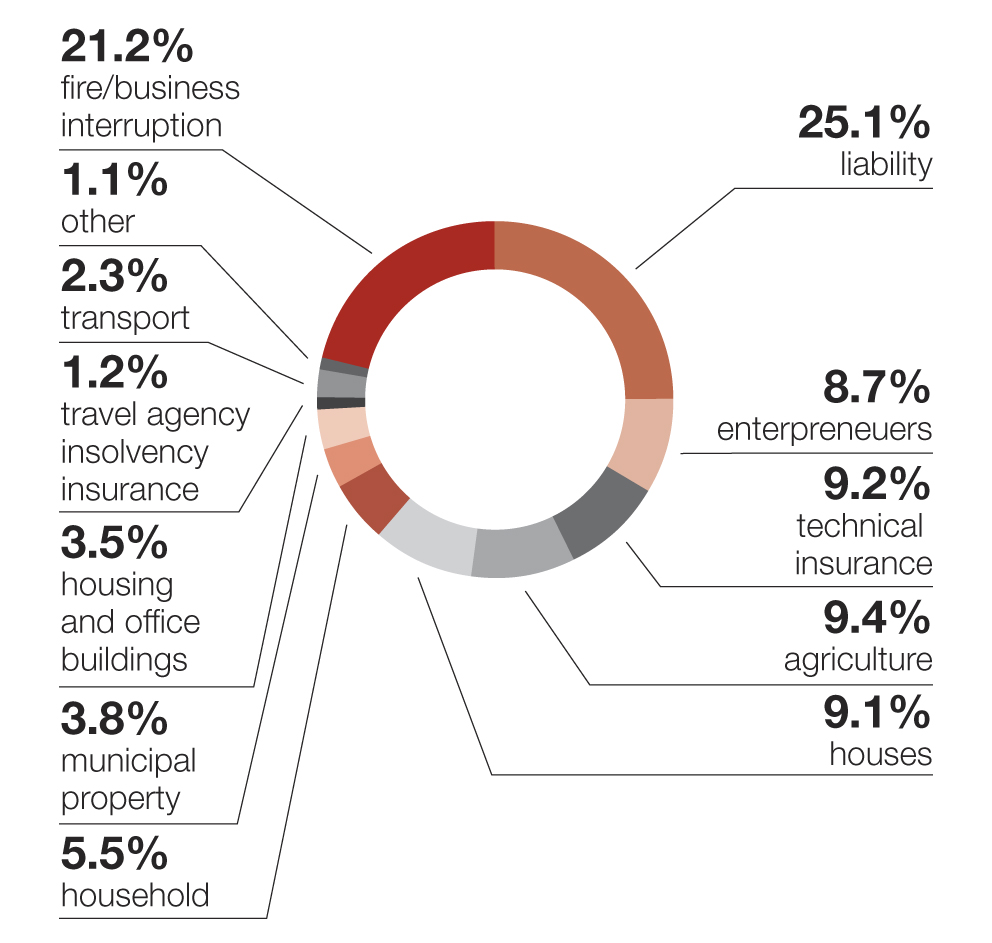
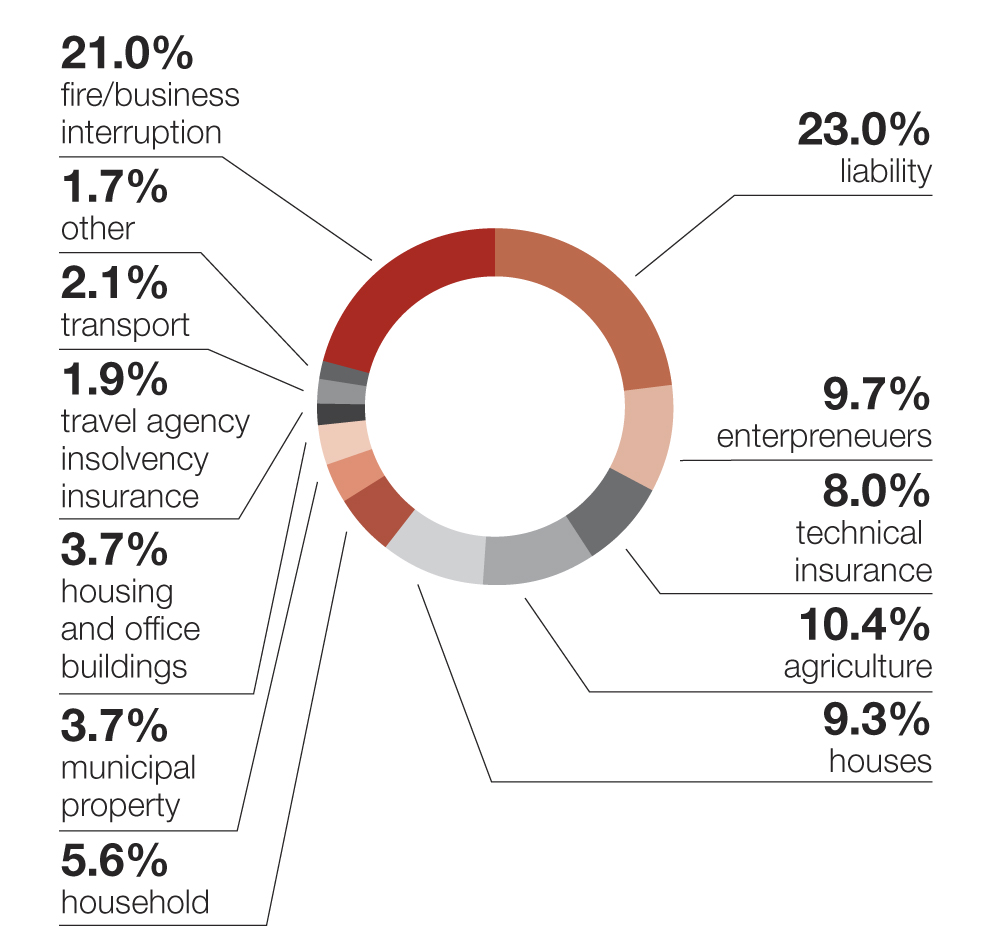
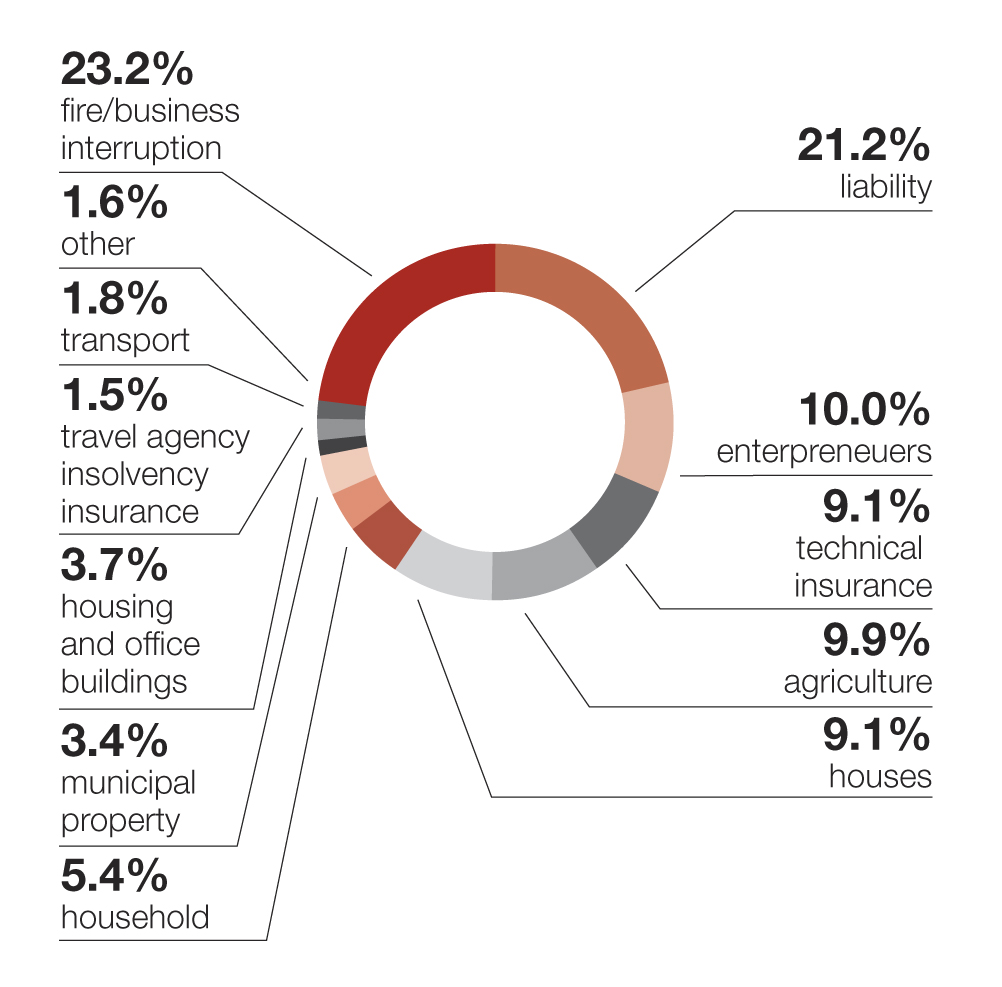
Property Insurance and Other Non-life Insurance
| CZK millions | 2015 | % | 2014 | % | 2013 | % | 2012 | % |
|---|---|---|---|---|---|---|---|---|
| Fire/business interruption | 524.5 | 21.2% | 507.8 | 20.7% | 523.7 | 21.0% | 597.4 | 23.2% |
| Liability | 622.1 | 25.1% | 607.3 | 24.7% | 572.8 | 23.0% | 546.1 | 21.2% |
| Enterpreneuers | 215.2 | 8.7% | 224.2 | 9.1% | 241.0 | 9.7% | 258.9 | 10.0% |
| Technical insurance | 227.2 | 9.2% | 199.5 | 8.1% | 199.4 | 8.0% | 235.6 | 9.1% |
| Agriculture | 233.7 | 9.4% | 238.9 | 9.7% | 260.3 | 10.4% | 255.0 | 9.9% |
| Houses | 226.1 | 9.1% | 229.4 | 9.3% | 232.9 | 9.3% | 234.7 | 9.1% |
| Household | 135.3 | 5.5% | 136.7 | 5.6% | 138.7 | 5.6% | 140.2 | 5.4% |
| Municipal property | 93.4 | 3.8% | 96.3 | 3.9% | 91.4 | 3.7% | 87.6 | 3.4% |
| Housing and office buildings | 86.9 | 3.5% | 88.3 | 3.6% | 91.2 | 3.7% | 94.6 | 3.7% |
| Travel agency insolvency insurance | 29.6 | 1.2% | 29.4 | 1.2% | 46.3 | 1.9% | 39.9 | 1.5% |
| Transport | 56.1 | 2.3% | 59.7 | 2.4% | 53.2 | 2.1% | 47.1 | 1.8% |
| Other | 28.4 | 1.1% | 40.2 | 1.6% | 41.7 | 1.7% | 42.1 | 1.6% |
| Total | 2,478.5 | 100.0% | 2,457.7 | 100.0% | 2,492.5 | 100.0% | 2,579.3 | 100.0% |
| CZK millions | 2011 | % | 2010 | % | 2009 | % | 2008 | % |
|---|---|---|---|---|---|---|---|---|
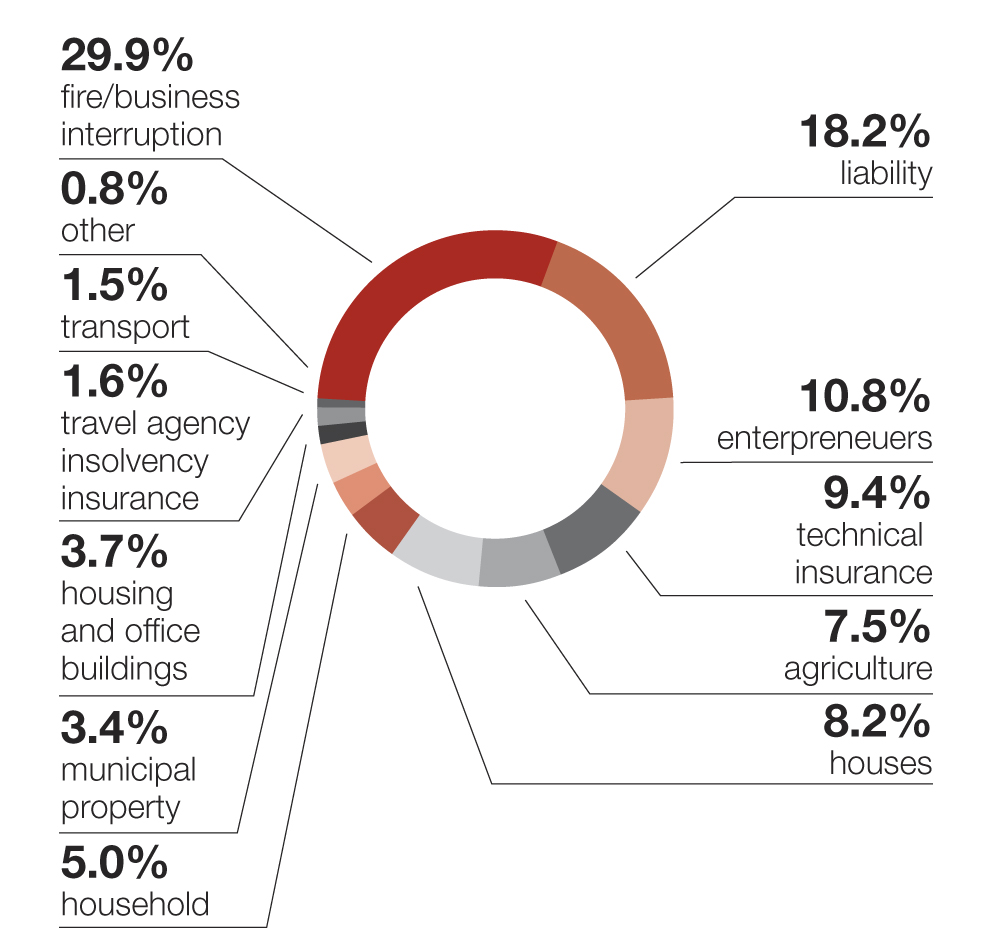
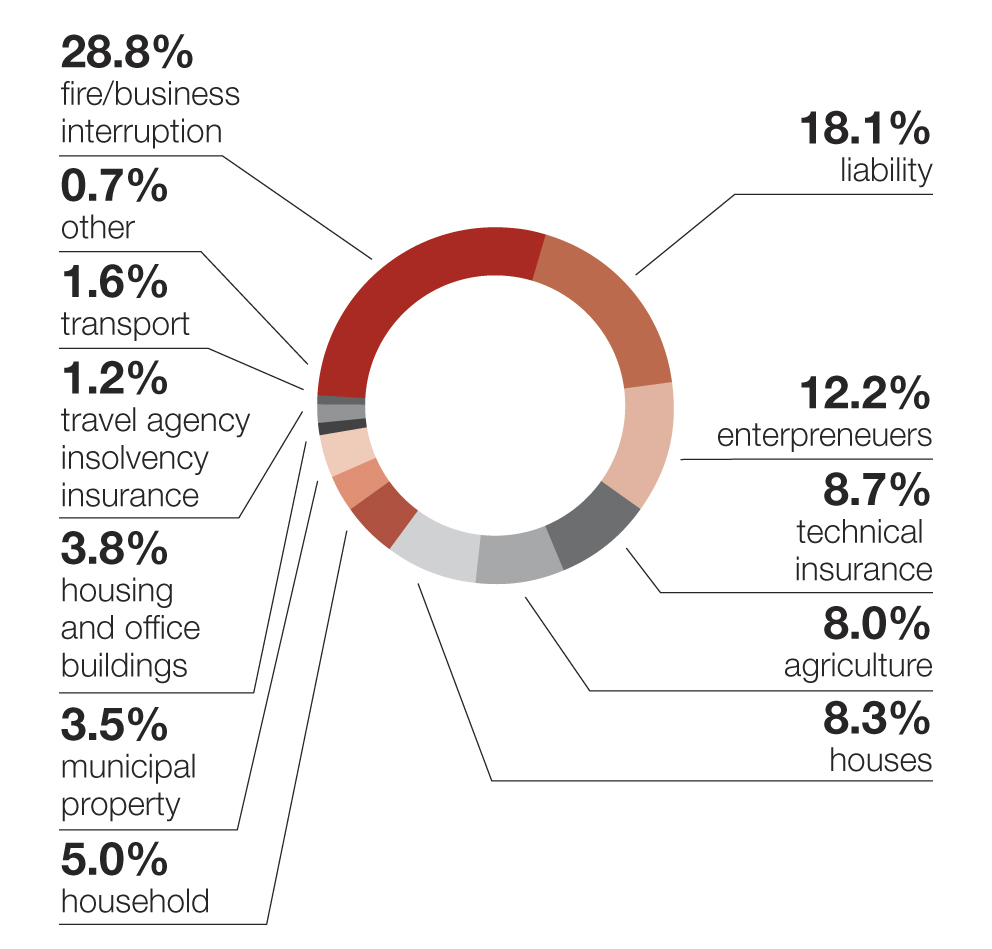
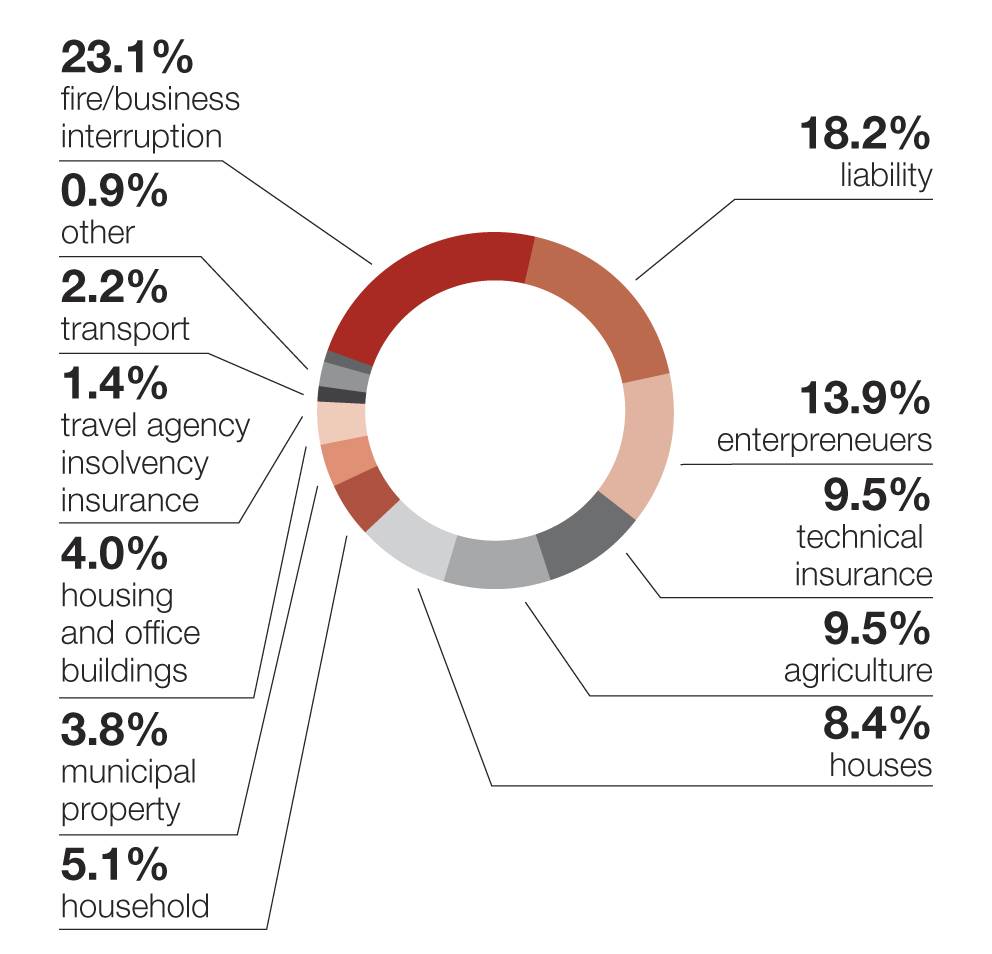
| Fire/business interruption | 743.8 | 27.5% | 797.3 | 29.9% | 718.7 | 28.8% | 509.8 | 23.1% |
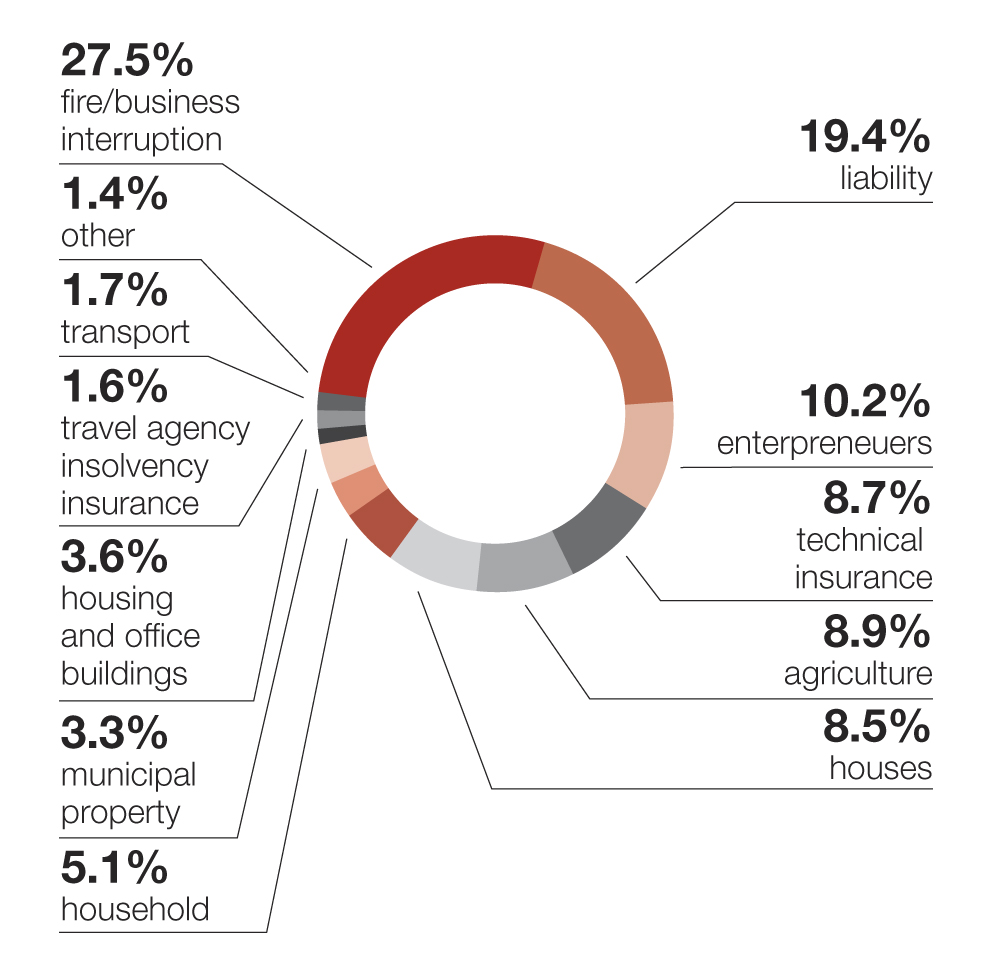
| Liability | 524.5 | 19.4% | 485.7 | 18.2% | 451.4 | 18.1% | 400.1 | 18.2% |
| Enterpreneuers | 275.5 | 10.2% | 288.5 | 10.8% | 302.8 | 12.2% | 306.8 | 13.9% |
| Technical insurance | 235.2 | 8.7% | 250.0 | 9.4% | 217.7 | 8.7% | 209.1 | 9.5% |
| Agriculture | 240.8 | 8.9% | 201.5 | 7.5% | 199.8 | 8.0% | 209.1 | 9.5% |
| Houses | 230.7 | 8.5% | 219.4 | 8.2% | 207.4 | 8.3% | 185.0 | 8.4% |
| Household | 139.0 | 5.1% | 132.2 | 5.0% | 124.4 | 5.0% | 113.3 | 5.1% |
| Municipal property | 88.1 | 3.3% | 92.1 | 3.4% | 86.7 | 3.5% | 83.4 | 3.8% |
| Housing and office buildings | 97.7 | 3.6% | 98.5 | 3.7% | 95.1 | 3.8% | 89.2 | 4.0% |
| Travel agency insolvency insurance | 43.0 | 1.6% | 41.8 | 1.6% | 29.4 | 1.2% | 29.8 | 1.4% |
| Transport | 47.1 | 1.7% | 40.1 | 1.5% | 40.3 | 1.6% | 47.8 | 2.2% |
| Other | 38.1 | 1.4% | 22.7 | 0.8% | 18.6 | 0.7% | 20.4 | 0.9% |
| Total | 2,703.5 | 100.0% | 2,669.7 | 100.0% | 2,492.5 | 100.0% | 2,203.8 | 100.0% |
2015
2014

2013
2012
2011
2010
2009
2008
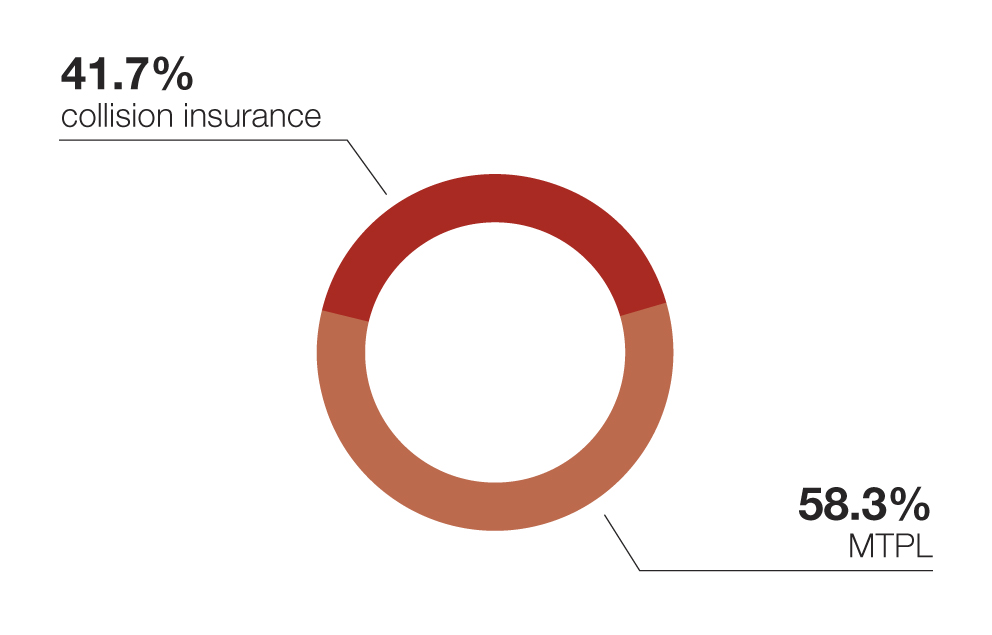
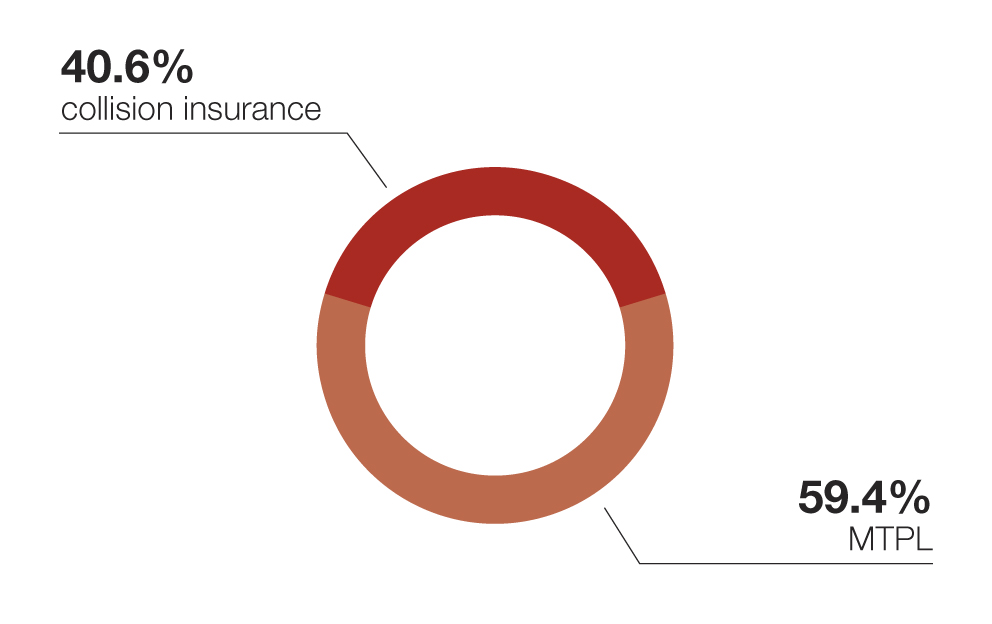
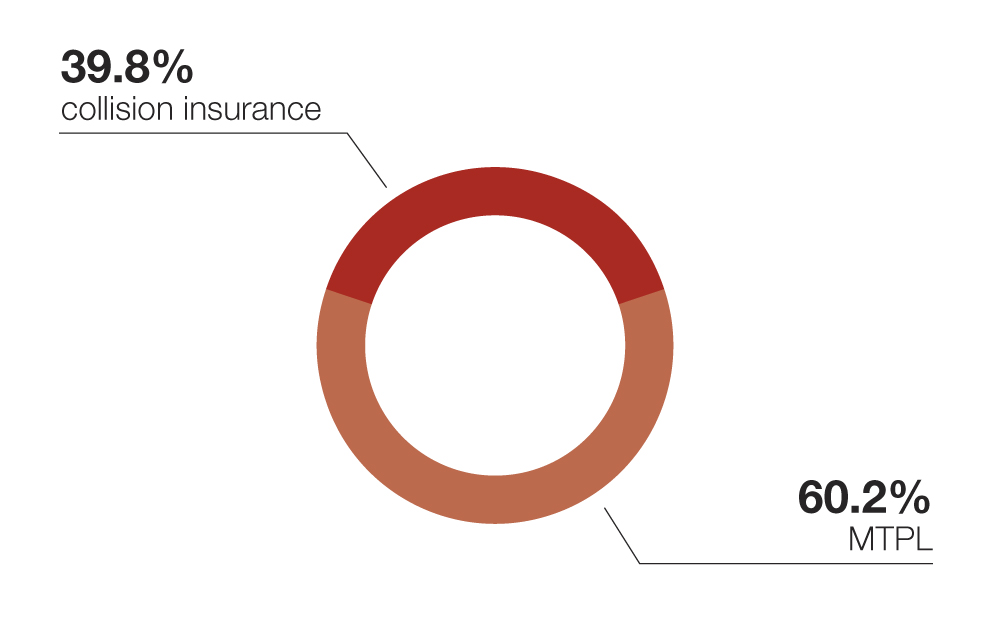
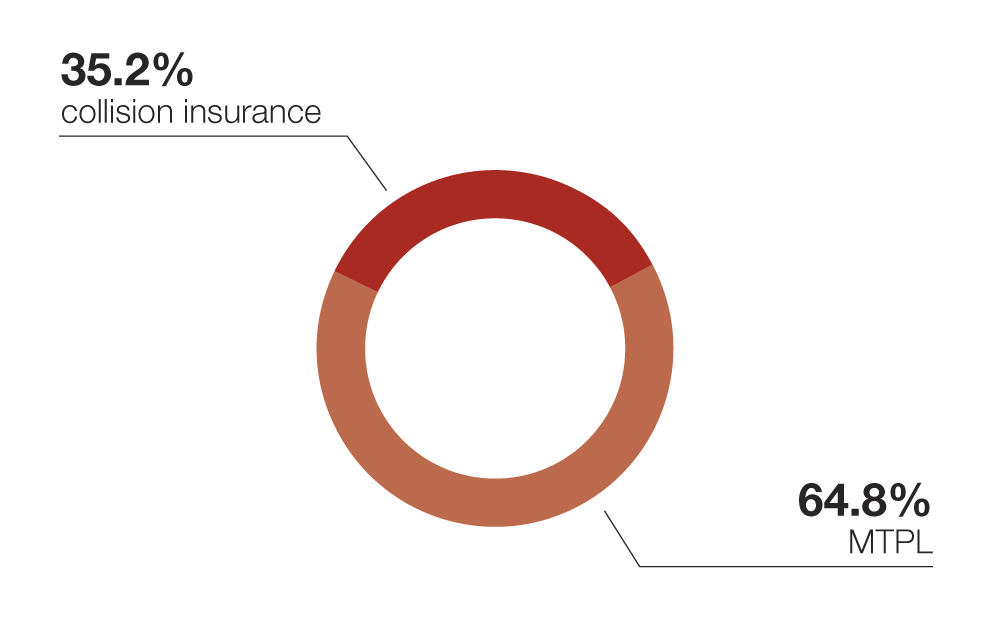
Motor Insurance
| CZK millions | 2015 | % | 2014 | % | 2013 | % | 2012 | % |
|---|---|---|---|---|---|---|---|---|
| Collision insurance | 1,167.1 | 41.7% | 1,049.0 | 40.6% | 934.4 | 39.8% | 911.4 | 37.6% |
| MTPL | 1,634.1 | 58.3% | 1,533.7 | 59.4% | 1,411.4 | 60.2% | 1,510.5 | 62.4% |
| Total | 2,801.2 | 100.0% | 2,582.7 | 100.0% | 2,345.8 | 100.0% | 2,421.9 | 100.0% |
| CZK millions | 2011 | % | 2010 | % | 2009 | % | 2008 | % |
|---|---|---|---|---|---|---|---|---|
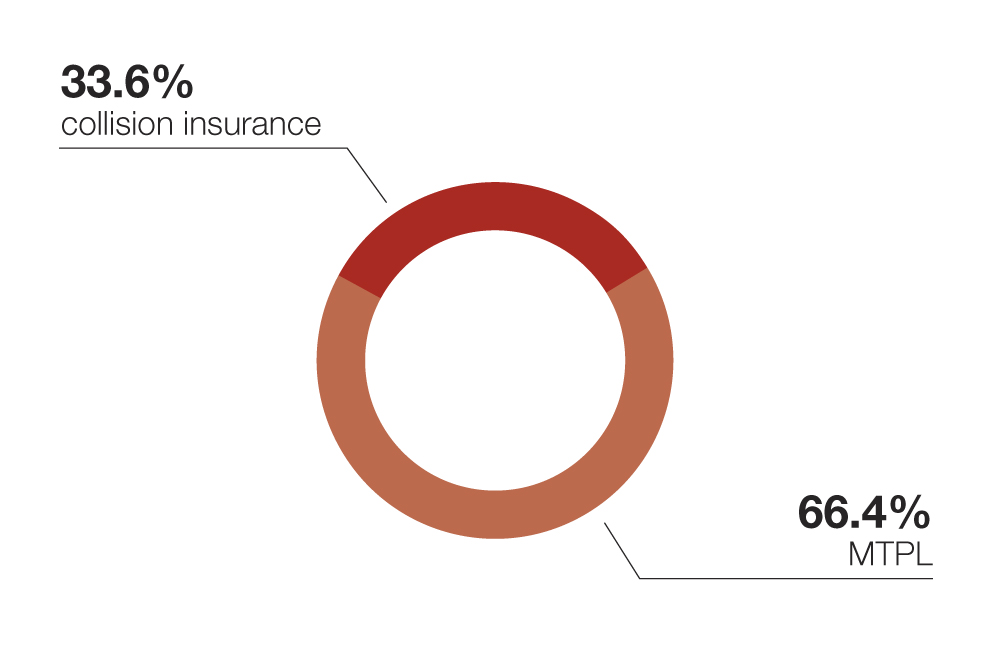
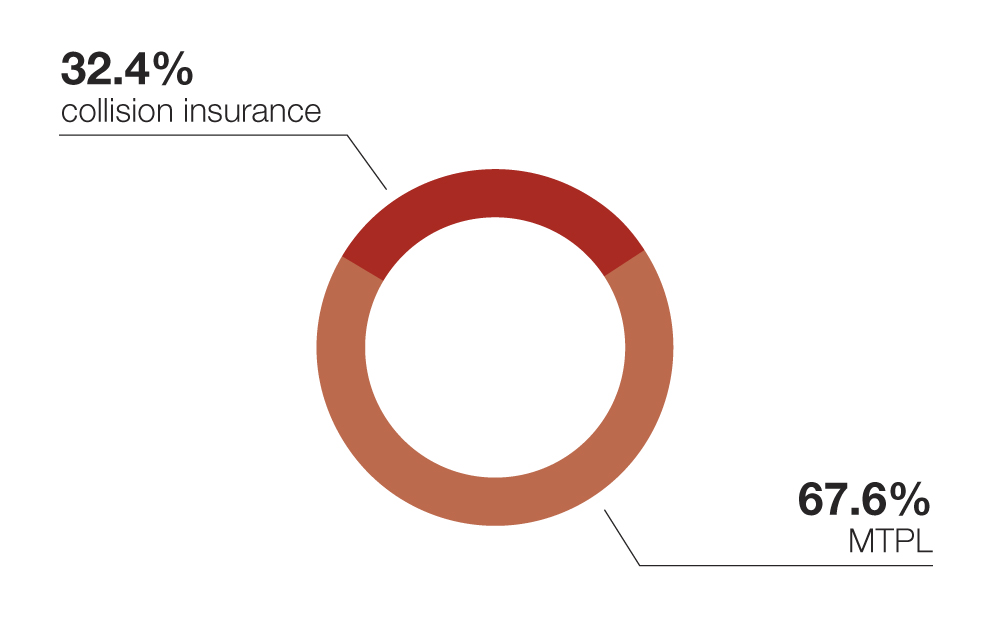
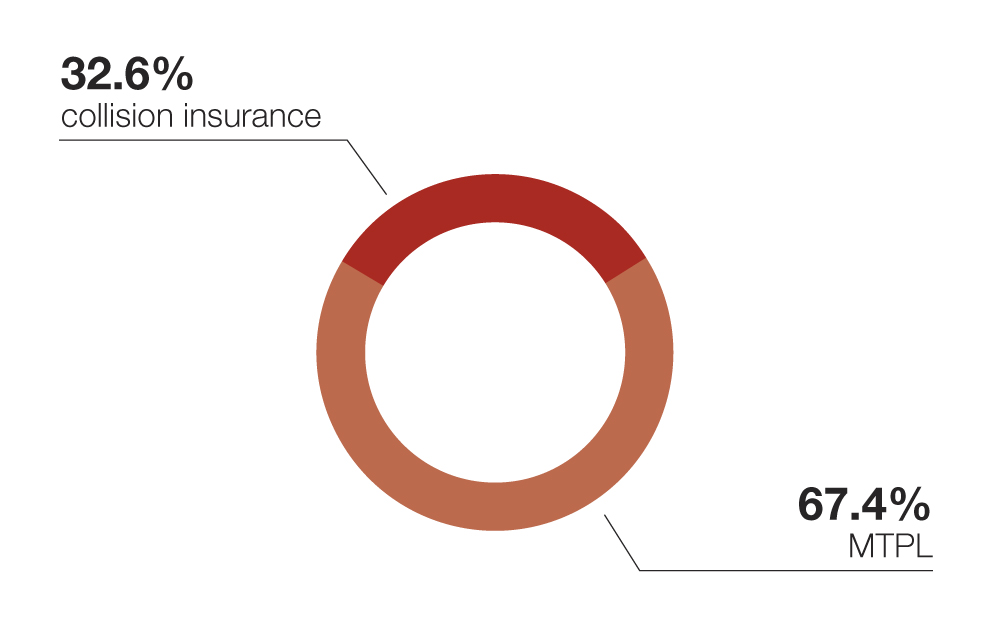
| Collision insurance | 994.7 | 35.2% | 1,043.9 | 33.6% | 1,136.5 | 32.4% | 1,127.8 | 32.6% |
| MTPL | 1,830.5 | 64.8% | 2,065.9 | 66.4% | 2,371.3 | 67.6% | 2,326.8 | 67.4% |
| Total | 2,825.2 | 100.0% | 3,109.9 | 100.0% | 3,507.8 | 100.0% | 3,454.6 | 100.0% |
2015
2014
2013
2012

2011
2010
2009
2008
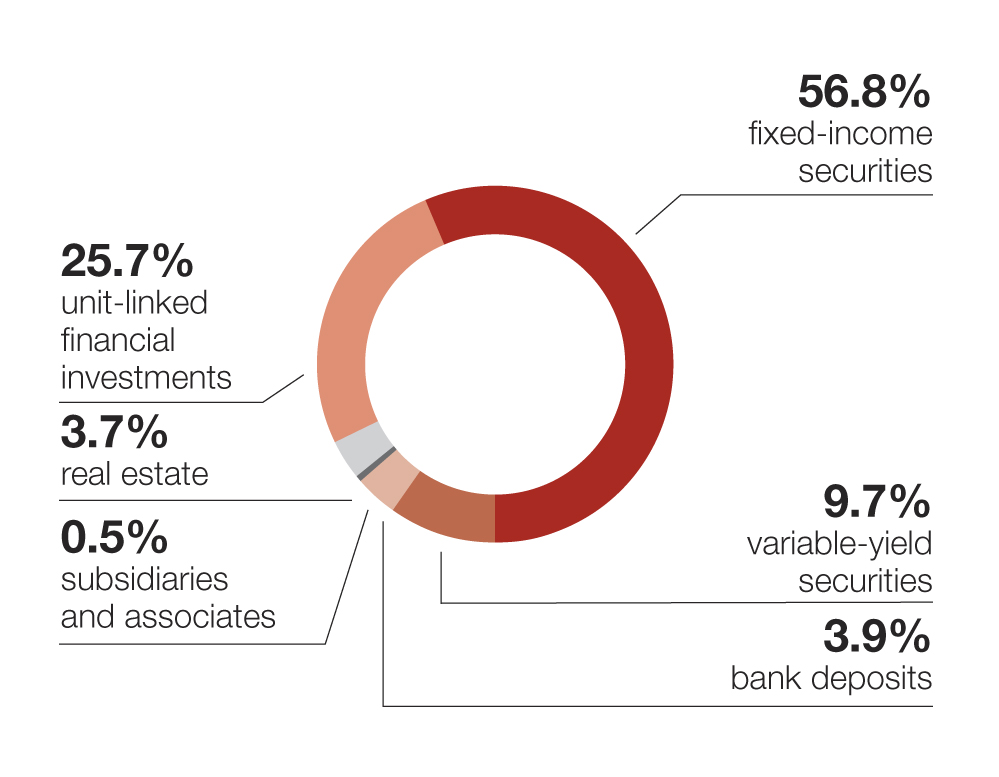
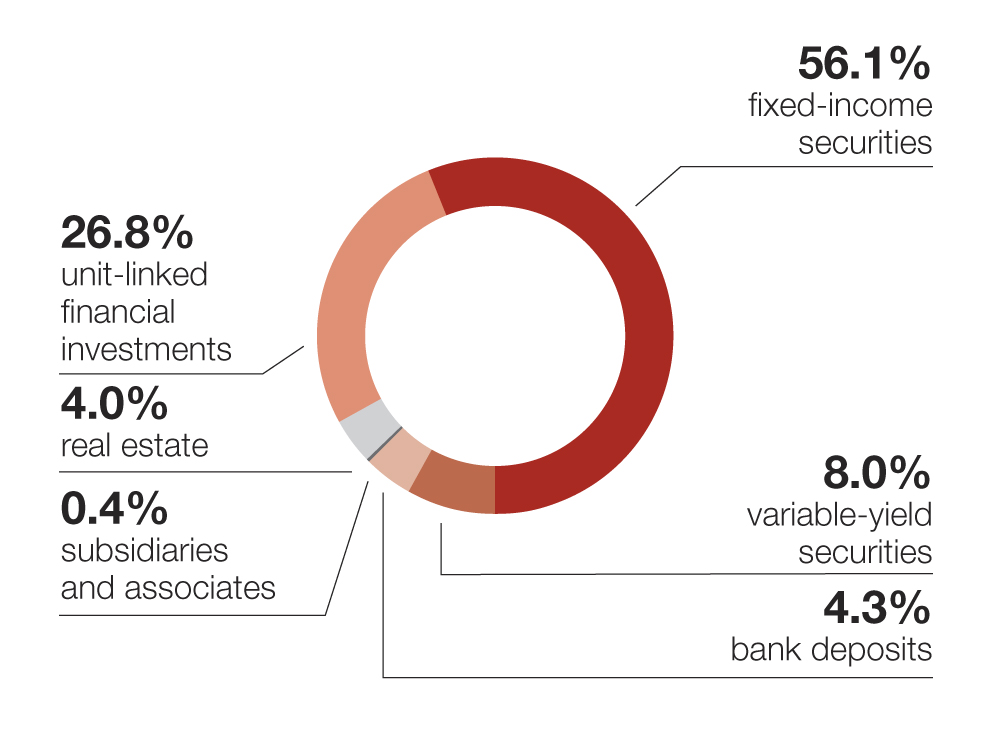
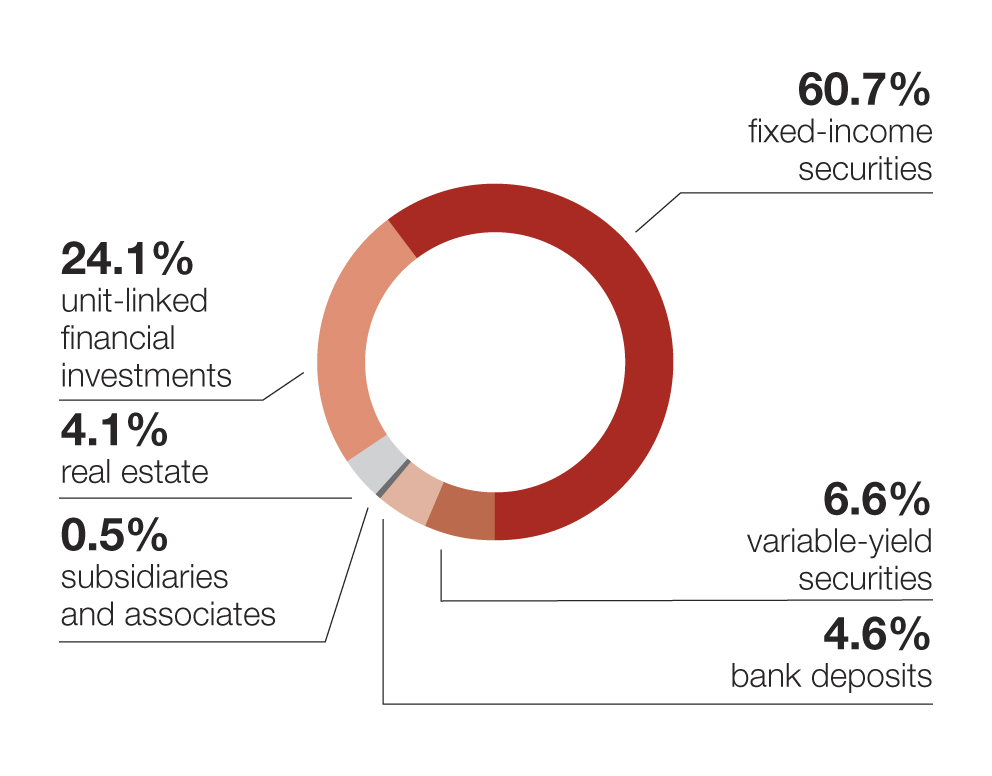
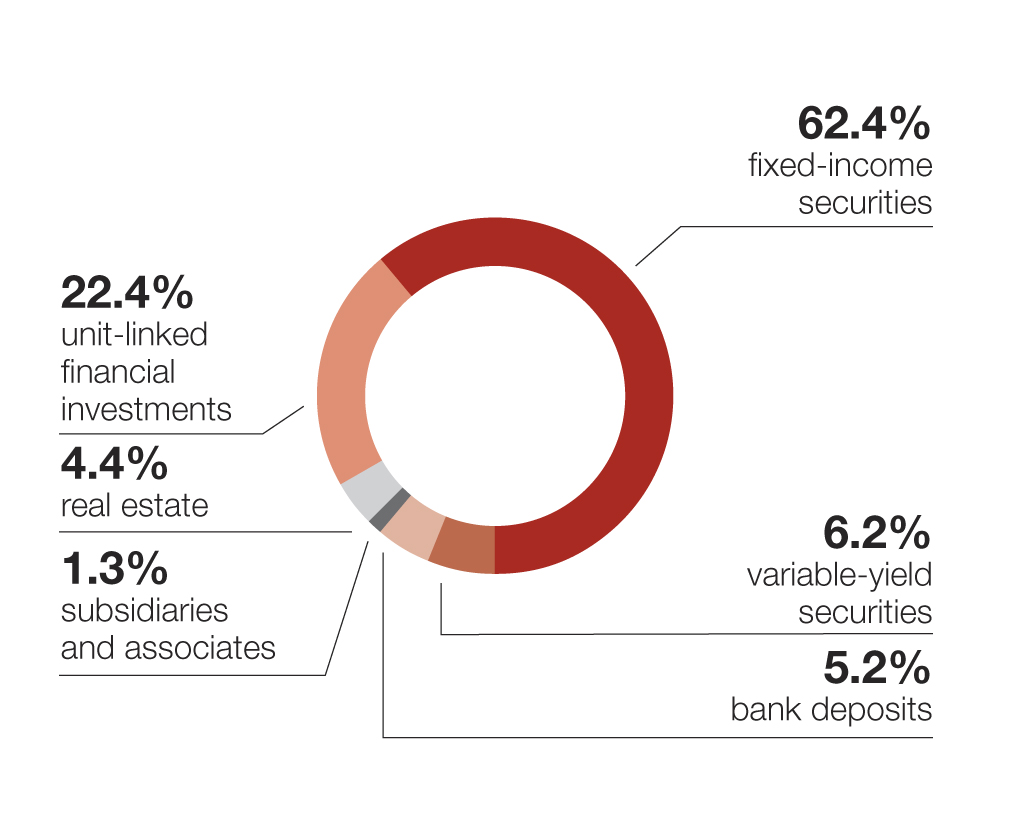
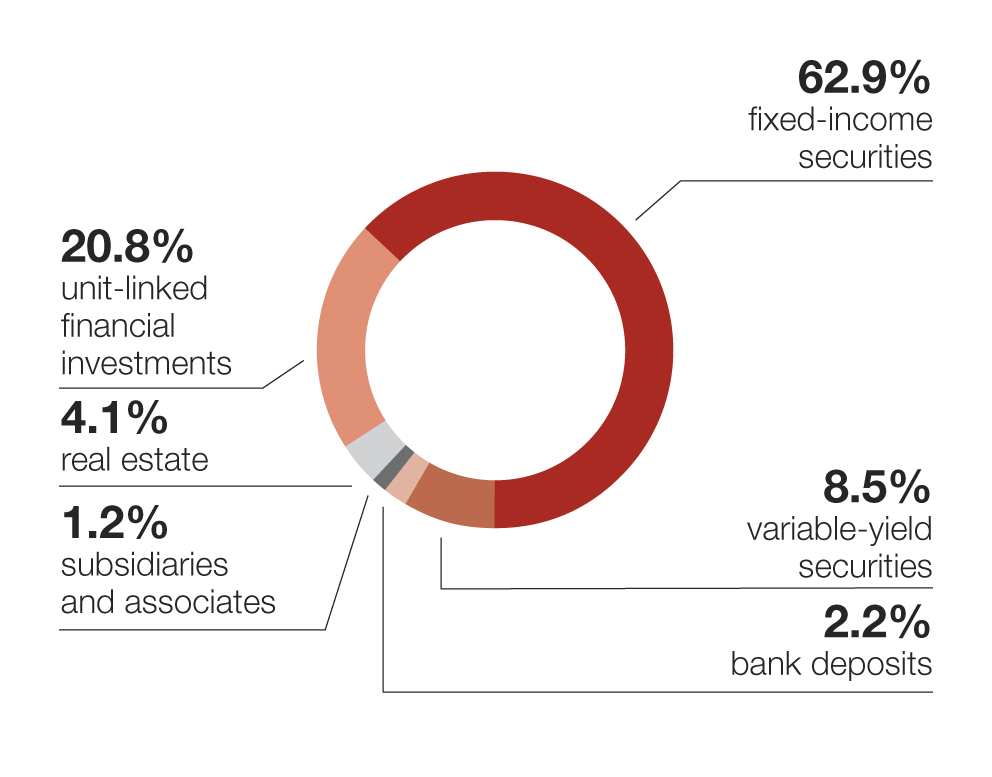
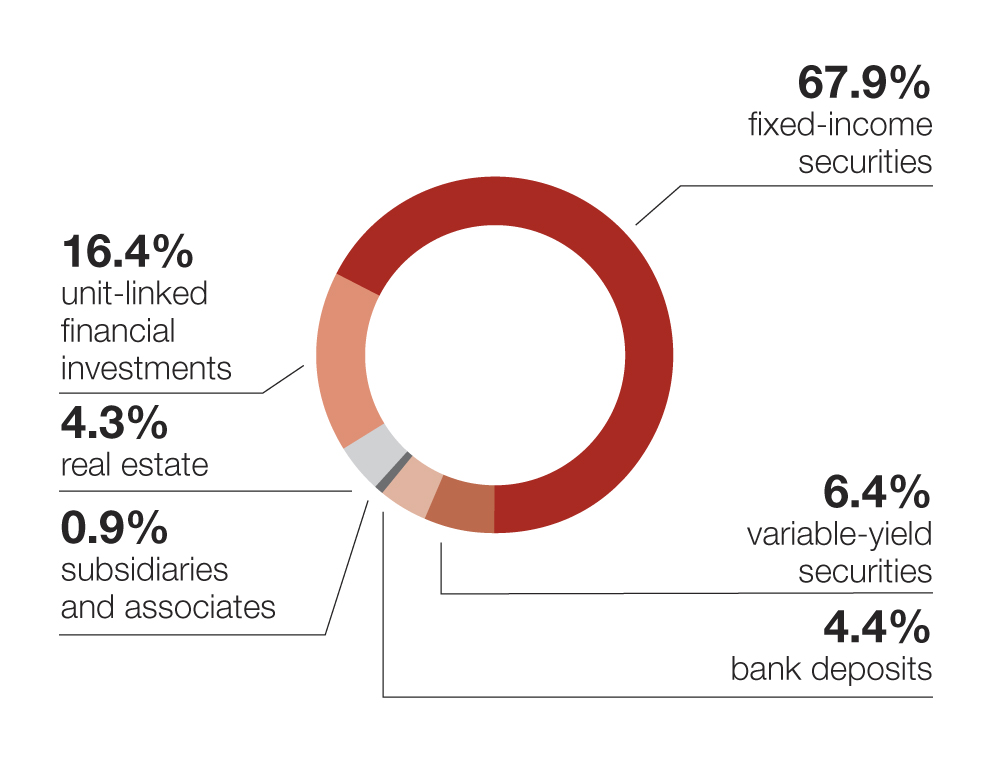
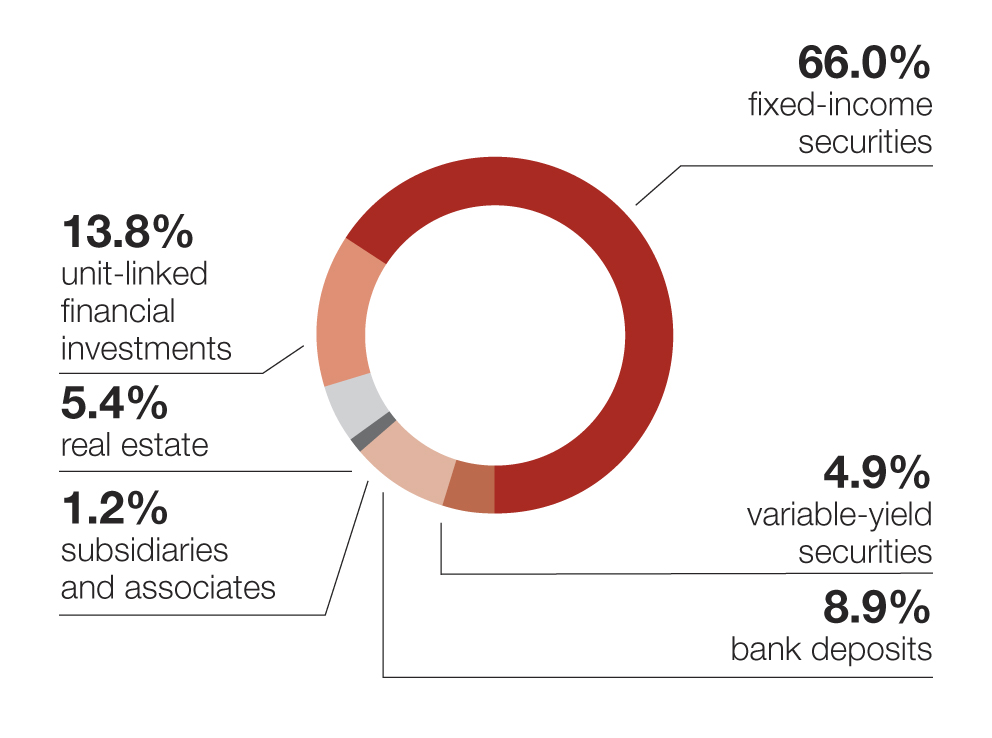
Financial Asset Structure
| CZK millions | 2015 | % | 2014 | % | 2013 | % | 2012 | % |
|---|---|---|---|---|---|---|---|---|
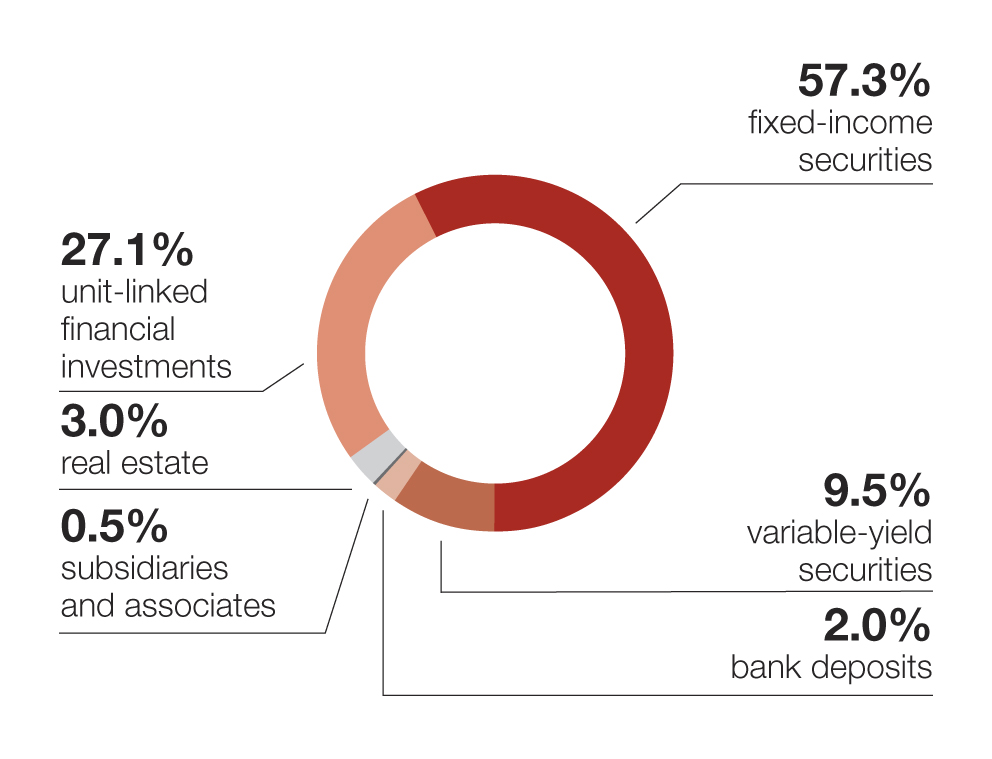
| Fixed-income securities | 11,571.9 | 57.3% | 10,552.0 | 56.8% | 10,007.8 | 56.1% | 10,816.3 | 60.7% |
| Variable-yield securities | 1,910.6 | 9.5% | 1,799.9 | 9.7% | 1,432.5 | 8.0% | 1,172.2 | 6.6% |
| Bank deposits | 410.6 | 2.0% | 724.6 | 3.9% | 772.4 | 4.3% | 813.4 | 4.6% |
| Subsidiaries and associates | 104.6 | 0.5% | 93.7 | 0.5% | 78.9 | 0.4% | 85.4 | 0.5% |
| Real estate | 608.9 | 3.0% | 678.7 | 3.7% | 713.2 | 4.0% | 723.0 | 4.1% |
| Other loans | 93.3 | 0.5% | 3.0 | 0.0% | 3.4 | 0.0% | 5.4 | 0.0% |
| Other investments (financial derivatives) | 29.9 | 0.1% | (37.9) | (0.2)% | 38.9 | 0.2% | (98.5) | (0.6)% |
| Unit-linked financial investments | 5,465.3 | 27.1% | 4,766.5 | 25.7% | 4,787.6 | 26.8% | 4,290.6 | 24.1% |
| Total | 20,195.1 | 100.0% | 18,580.5 | 100.0% | 17,834.7 | 100.0% | 17,807.7 | 100.0% |
| CZK millions | 2011 | % | 2010 | % | 2009 | % | 2008 | % |
|---|---|---|---|---|---|---|---|---|
| Fixed-income securities | 10,159.7 | 62.4% | 11,054.5 | 62.9% | 11,335.1 | 67.9% | 8,792.9 | 66.0% |
| Variable-yield securities | 1,044.5 | 6.2% | 1,500.8 | 8.5% | 1,070.3 | 6.4% | 647.4 | 4.9% |
| Bank deposits | 843.0 | 5.2% | 391.4 | 2.2% | 742.2 | 4.4% | 1,181.5 | 8.9% |
| Subsidiaries and associates | 206.9 | 1.3% | 208.1 | 1.2% | 156.9 | 0.9% | 163.0 | 1.2% |
| Real estate | 717.1 | 4.4% | 720.8 | 4.1% | 716.4 | 4.3% | 713.3 | 5.4% |
| Other loans | 5.2 | 0.0% | 7.7 | 0.0% | 7.2 | 0.0% | 6.1 | 0.0% |
| Other investments (financial derivatives) | (295.0) | (1.8)% | 37.7 | 0.2% | (80.4) | (0.5)% | (19.0) | (0.1)% |
| Unit-linked financial investments | 3,643.7 | 22.4% | 3,652.3 | 20.8% | 2,736.7 | 16.4% | 1,843.3 | 13.8% |
| Total | 16,285.2 | 100.0% | 17,573.3 | 100.0% | 16,684.4 | 100.0% | 13,328.4 | 100.0% |
2015
2014
2013
2012
2011
2010
2009
2008
Solvency and Minimum Solvency Capital
| CZK thousands | 2015 | 2014 | 2013 | |||
|---|---|---|---|---|---|---|
| Non-life insurance | Life insurance | Non-life insurance | Life insurance | Non-life insurance | Life insurance | |
| Solvency capital requirement | 656,293 | 471,657 | 656,293 | 455,007 | 656,239 | 437,673 |
| Available solvency capital | 1,386,761 | 1,225,059 | 1,279,751 | 876,233 | 1,062,897 | 853,350 |
| Available and required solvency capital ratio | 2.11 | 2.60 | 1.95 | 1.93 | 1.62 | 1.95 |
| Minimum solvency capital | 375,983 | 370,433 | 364,655 | |||
| Minimum and available solvency capital ratio | 0.14 | 0.17 | 0.19 |
| CZK thousands | 2012 | 2011 | 2010 | |||
|---|---|---|---|---|---|---|
| Non-life insurance | Life insurance | Non-life insurance | Life insurance | Non-life insurance | Life insurance | |
| Solvency capital requirement | 656,293 | 437,548 | 656,293 | 424,707 | 656,293 | 412,283 |
| Available solvency capital | 1,114,629 | 1,066,515 | 828,151 | 768,378 | 1,434,157 | 1,012,356 |
| Available and required solvency capital ratio | 1.70 | 2.44 | 1.26 | 1.81 | 2.19 | 2.46 |
| Minimum solvency capital | 364,614 | 360,333 | 356,192 | |||
| Minimum and available solvency capital ratio | 0.17 | 0.23 | 0.15 |
Ratios
| 2015 | 2014 | 2013 | 2012 | 2011 | 2010 | 2009 | 2008 | |
|---|---|---|---|---|---|---|---|---|
| Return on average assets (ROAA) (profit or loss for the accounting period/total assets) | 2.40% | 1.30% | (0.23)% | 3.35% | 0.85% | 4.13% | 5.34% | 0.74% |
| Return on average equity (ROAE) (profit or loss for the accounting period/equity) | 19.17% | 11.59% | (2.19)% | 28.76% | 9.15% | 31.55% | 40.86% | 6.90% |
| Non-life “Combined ratio” | 95.39% | 98.36% | 104.43% | 100.14% | 99.94% | 90.95% | 99.49% | 92.93% |